Hey all,
First of all, very sorry about the lack of updates the last couple of days, but would you believe TODAY is the due date of baby Akuma, but of course, I would not be writing this if it was on it's way ;). My trading activity has been very low lately, but Ill be sure to post at least the results soon, but instead, I thought I would put together a new theory article for you all, this time about Fibonacci.
Fibonacci was named after a mathemetician and trained accountant by the name of Leonardo Pisano in the 1100's (ah yes I remember them well ... those were the days). He came up with, amongst other things, a series of numbers that is now referred to as the Fibonacci sequence, where each number is the sum of the two numbers preceding it. Here is the beginning of it, and of course it goes on to infinity:
1, 1 (1+0), 2 (1+1), 3 (2+1), 5 (3+2), 8 (5+3) etc.
 The blue dotted lines are the fibonacci lines that correspond to the ratio's I was talking about. You can see in the move up, that the 38.2 fibonacci line formed the point for the price to reverse its retracement and continue with the trend (support). Of course, any of these lines could have been the points of reversal, but a reversal at the 38.2 line is a good sign that the trend will continue as the retracement was shallow.
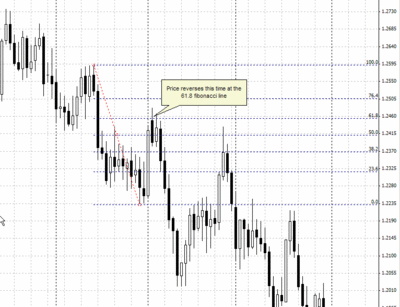
The other line that I find most commonly hit is the 61.8 line as shown here:

Be a little more wary when such a deep retracement occurs, as it is less likely (although not in the above case) that the previous support will be broken again.
So what do you do with this knowledge? Can you trade with fibonacci alone? In my opinion, no as you don't know which line will be the turning point without the aid of other indicators or reading the price action, but they can be an excellent addition to your trading system to confirm other signals. For example if you have a signal from another indicator telling you a reversal is about to happen, and price is hovering at a fibonacci line, this might give you added confidence to place the trade.
Happy trading!