Was based on the picture on hope bull will happen when candle or the bar chart finally was formed higher from before and touched the red line ,but psychologically should not be cheated by the pattern chart (see timeframe one hour) like the price yesterday that be the same as today that continued down,maybe the price will down like yesterday or deceit only ???
Even you have known forex trading in a few days,you can get rich today by using my simple strategy on cable(pound) currencies ,don't believe just see it above when price hit blue line .can you tell what is bullish or bearish mean,it just a name and mean nothing.(timer 20 : 20 jakarta today 31 july )
Thursday 31 July 2008
today pound signal for another days timer 18.47 (jakarta )
Tuesday 29 July 2008
JULY 30,2008 cable pair prediction

The trap was formed in daily chart,according to the public's habit at this time was bearish trend.Daily range movement has been reach out 150 point more, maybe the correction pattern could be created,if it were happened we should use fibonacci pattern 123 elliot wave to solve it.


Attempt to buy on this situation after fibo 123 line will created.combined with another indicator recommended on blog of mine
Sunday 27 July 2008
How to see future signal prediction ?
Signal was coming from the deep analysis of fundamental news and then it would be executed by technical indicator.So that it was difficult for me to give the explanation about signal to the form of certain figure because that was impossible for me,considering market was dynamic not like mathematic.Ok i am directly to the point how to predict future signal analysis. 
Making trap was perfect condition for cable pair for the next couple day,if the bull candlestick daily chart would create comfirm ,the bullish momentum will occured.Just see it occured is my expectation but maybe monday sideway market still have a chance , remind that the related news was a little.
Saturday 26 July 2008
How to gain hundred pips on your trading ???
I studied forex in a manner of the autodidact method through trial and error system, at that time forex for me was same
with gambling which its contain lose or win .But later that opinion tasted untrue because if forex were a gambling why always lost?.Why another people always won?.Is forex trading a gambling?.
Here some forex trading system to answered it that forex was not a gambling:
The first picture above show us how to see reversal bullish signal that was began when the Macd indicator period 96,576,9 timeframe 15 minutes show its Value line number more bigger than Signal line number.(source : overdrive trader)
The second picture above show us how to see the power of bullish strengthen after watching the first picture.The tools are MA 4 (yellow line),MA 13 (red line),and MA 50 (blue line).On timeframe 4 hour we see that MA 4 across MA 13 and will hit MA 50,if crossline between MA 4 and MA 13 will hit MA 50 the power bullish strengthen will occured after waiting RSI indicator upper 50%.(130 pips,my trade last night on july 25 ,2008)
Wednesday 23 July 2008
Theory: What To Trade?
... I can't tell you what to trade as much as the next person, essentially you need to make that decision yourself ...
Hi there!
Time for another theory article while the markets are quiet, this time on the first question asked by every new trader I see in the chat rooms, "Can someone tell me what to trade?". Now I can't tell you what to trade as much as the next person, essentially you need to make that decision yourself, not rely on others to tell you what to do, but we can look into how some currency pairs behave to give us a hint into what will suit you.
There are a multitude of currency pairs out there, pick a countries currency, and there will probably be a broker out there trading it, but what we want to look at is the most commonly traded pairs, or the majors as they are refered to. Below is a list of the major currency pairs most commonly offered:
- EUR/USD (Euro/US Dollar)
- GBP/USD (Pound/US Dollar)
- USD/CHF (US Dollar/Swissy)
- USD/JPY (US Dollar/ Yen)
- AUD/USD (Australian Dollar/US Dollar)
- USD/CAD (US Dollar/Canadian)
 Now what do you notice is the common theme through them all? Yep the USD, all the majors either have the USD as the base currency or are matched against the USD. You will find the above list will also have the tightest spreads (see Forex 101 for an explanation on spreads) with most brokers, and will have the biggest daily ranges (difference between the daily high and low).
So what to trade?, if you are a beginner trader, without a tested and trusted system in place, it would be best to choose a couple of these pairs only. More than 2 or 3 will more than likely confuse the buggery out of you, and the last thing we need is to trade confused (I live my life confused, so I would rather not trade that way ;)).
The GBP/USD (known as the "cable") is very popular amongst traders as it tends to have the highest daily range, giving up more pips in it's moves than any other on average. The EUR/USD is also popular as it tends to have the smallest spread with most brokers, why the USD/CHF is another that has some substantial movements.
... as you trade you will start to notice the relationship between the different majors ...
Quite often which pairs you choose might be to do with when you trade. If you tend to trade the asian session the most, the pairs that include asian or oceania currencies would be a good choice such as the USD/JPY, AUS/USD or even, while not a major, the NZD/USD. Those trading the european session of course might choose teh EUR/USD or the GBP/USD, which just about all the majors are ok to trade during the US session.
As you trade you will start to notice the relationship between the different majors, such as how the EUR/USD and GBP/USD tend to mimmick each other, and that if the EUR/USD is going down, then more than likely the USD/CHF is going up. This of course is because they both have the USD as part of their pairing, so if the USD is getting stronger, the EUR/USD will be moving down (Euro getting weaker against a strengthening USD) and the USD/CHF moving up (USD strengthening against the Swissy).
The only exceptions to this relationship will be when country specific news is released, such as a good economic meter reading in switzerland might move the USD/CHF but not the GBP/USD and so forth.
Whichever you choose, there is money to made and lost just as quickly, so be sure to keep your money management tight and your head clear.
Happy trading!
Theory: When To Trade?
The question quite often comes up about when are the best times to trade? Everyone has their own ideas on what they think is the best time to trade, and quite often it depends on what type of system you are using. If you run a system that looks for trends, the best time for you would be different for a system looking for breakouts.
Rather than get into all that however (again just google "best forex trading times" for plenty of info on that) let's look at the best times to trade based on your experience instead.
A beginner, I would think, would be someone new to the forex markets, someone who has yet to fully develop their trading system, or, if they have, find it hard to maintain the discipline to stick to it no matter what. Some things that might identify a beginner trade could be:
- Unaware of stop losses
- Unsure of trend identification
- Looking at one timeframe only (probably the 5M or 15M)
- Quick to jump into a trade, slow to get out
- Hazy on when to exit a profitable trade
With those points in mind, the safest trading time would be one where:
- The chances of big losses are low
- You have time to think you trades through
- There are some defineable trends to help you out in getting on the right side of the trade
- Sharp, quick movements in the opposite direction to your trade aren't common
So when is the best time to trade based on the above? Well lets look it another way, what are the times where the above points are not met. My opinion? The opening of the different markets! There are three major markets to look out for, the Asian market, the European market and the US market. The opening and closing of these markets are often the most volatile, with sharp movements up and down with no apparent order quite often seen and many a beginner trader crying foul over a sharp reversal on their trade they have just been watching for the last hour.
 Look at the above chart, this is a 15M chart from late last week of the EUR/USD. I have highlighted two areas, which is the opening of the European and US markets. Notice, how just before the opening of the price was slowly trending in one direction, but then, as the respective markets opened a sharp reversal sprung up in the opposite direction, taking with it many peoples profits I am sure, and spoiling many a traders tea. You find this espectially on the opening of Europe.
The best times for quiet, trending activity tends to be in the middle third of the trading sessions, the middle of the Asian session is a less volatile time, but can be too quiet for some. Approaching the opening of the European sessions, activity tends to pick up, but remember, be careful come opening time. I prefer the mid European session, but rarely get to trade it due to the time differences here in Australia, the mid US session can also be good but usually I am so buggered by that time, my decision making is shocking.
So pick what you prefer, if you are in it for a fast buck and don't care about making it a possible career, then opening and closing times can be right up your ally, but if you want to test out a system you are developing, look at the mid session times that suit you. Remember though news releases and data can effect everything, so always keep an eye out on the news anytime you trade.
Remember, this is not necessarily the most profitable time to trade in terms of pip movement, but while you are picking things up, minimising the chance of your account being wiped out is always a good idea.
I hope this helps someone, you can get the current times in the different areas by using this great little forex clock here. For my fellow countryfolk in Australia, below are the opening and closing times in AEST (thanks to aaron on Marketiva for these):
[AUS open 8:00am close 4:00pm]
[JYP open 10:00am close 6:00pm]
[EUR open 4:00pm close 12:00am]
[GBP open 5:00pm close 1:00am]
[USD open 10:00pm close 6:00am]
Ill leave it with a quote I read somewhere:
"Ametuers open the markets, professionals close them"
Theory: When to Exit
...you actually make bugger all money if you can't execute and exit as precisely as you entered...
Hi all, Welcome to another article, this time on when to exit a trade. When beginner traders start looking for that magic "make me a bucket load of cash" trading system, quite often the last thing thought about is their exit strategy. Usually the first and most important thing on a traders mind is when to enter a market, forgetting that you actually make bugger all money if you can't execute and exit as precisely as you entered.
There are three main scenarios that a trader will find themselves thinking of their exit:
- A trade has moved as expected and they are in profit
- A trade has moved opposite to what they expected, and they are in loss
- A trade is dancing around the neutral zone of their trade
- A trade has moved as expected and they are in profit (GREED)
- A trade has moved opposite to what they expected, and they are in loss (OPTIMISM)
- A trade and dancing around the neutral zone of the trade (FEAR)
Cannot close a profitable trade (Greed)
 Everyone fights greed every day in life, always "wanting" rather than sticking to what you actually "need". It is part of a materialistic modern day culture that most of us are subject to. Trading is no different, and it is usually greed that can turn a nice logical, well planned and profitable trade into a losing one. When this happens, a trader reacts two ways, one, they are distraught at themselves for letting it all get away, or two, they tell themselves "well I was right with my prediction, the market just had it in for me".
Think of this, you set up a trade, monitor the setup closely, wait for the exact time to enter a trade, calculate your stop loss, your order is hit and you are in the trade. The price action moves beautifully, moving quickly towards your scantily thought about target (if you set one), and the sense of delight sends your brain into overdrive, working out the profits, imagining the ferrari soon to be in the drive-way, wondering if 2000 pips has ever been done in one day. This is when you know you are in some trouble, this is when greed has started to set in, you remove your profit target thinking "let's see how long this goes", you don't move your stop loss, cause you don't even contemplate that it might reverse, and you "go for the ride".
A common saying is "cut your losses, and let your profits run" (or something like that ;)), and it is a very good theory that should be followed. However, how do you ride your profits, without risking a reversal that you will undoubtedly put down to "a correction that will soon move back my way".
Personally I look at it this way:
- Move your stop loss to break even or better as soon as is logically possible without risking being whipsawed out, that will ensure you will not lose money on the trade, ease the stress, and bring peace to the world (ok maybe not that). I take the view of never let a winning trade turn into a losing one so at least lock in 1 pip if it makes you feel better.
- If the move was stronger that you anticipated, and you had a 20 pip profit target. Remove your profit target, and move your stop loss to the profit target as soon as possible. What you effectively have done is close your trade (because your stop loss is at your original target) and you are letting your profits run at the same time, two for the price of one, bargain!
- Continue to follow the trade with your stop loss, and remember, 20 pips was your target, be satisfied with whatever you can get after that, but don't take any less. You can use one of the many trailing stop techniques to do this or look at the parabolic SAR indicator.
I was tempted to use the word "Dillusion" for this one but felt perhaps that is a little harsh, you know the deal, you enter a trade, you set a 25 pip stop loss, the trade moves the wrong way and you are -20 on the trade, you look at the chart again frantically, and optimistically think "Oh of course ... I should have set the stop loss beyond that resistance level from the year 1967, what was I thinking" and you change your stop loss, making it -35. The price continues to move in the wrong direction, and you either cop a -35 pip loss instead of -20, or you remove your stop loss all together and spend the next week driving everyone nuts asking "will the EUR/USD go up?" to every trader in the chat room.
... Some may say, that they removed their stop loss and eventually, their -100 pips turned into +10, so there .. stick that up your jumper ...
 What you do when you move a stop loss further away from entry, is completely change the ratio of the trade you entered. What was originally a 2:1 trade, i.e. your potential gain was twice as large as your potential loss, becomes a 1:1 trade, which is just asking for a margin call very quickly.
My advice on this? NEVER NEVER (I think that is pretty clear) move a stop loss further away from your entry, you can move it closer or break even if you wish, as this improves your risk/reward ratio, but never away. Some may say, that they removed their stop loss and eventually, their -100 pips turned into +10, so there .. stick that up your jumper ... the only problem is, that while they waited the week out waiting for the price to turn around (sometimes it never does .. look at the USD/JPY at the moment) they have tied up the entire margin, meaning they are locked out of many many more potentially profitable trades. So while you might end the week at +10, in the meantime other trades cut their losses at -20, entered 15 more trades in the week, and finished +100 for the week and at the same time learnt a hell of a lot more.
You want to close a trade dancing around the neutral zone (Fear)
This one is different, this is when you have a trade at +1, 0 or -1 pips, right around your entry, and it hangs there for quite a while, what do you do? Do you take a really small gain of +1 "just in case" it turns? Personally, and this one is up to you, I say never close a trade around the neutral zone of a trade, the ultimate aim of a trader, is to see a movement before the majority of others, you can then get in early, and when the others have caught up, let them make you money.
If you have spent the time analysing a trade, trust your judgement, if you analysed correctly, you may have got in early and it will take some time for the others to catch up. Don't be fearful of a losing trade, instead trust what you saw in the first place when you placed the trade. Sure there will be times when you end up losing, but if you cut your losses and let profits run, then you will be well in front in the end.
... If a trade has moved 1 pip past your target (that you have not automatically set), why close it? ...
So that is it, to summarise:
- Always assess your potential profit target, and close, or lock it in as soon as possible with your stop loss.
- Never move a stop loss away from your entry price.
- Don't be fearful you could be wrong, instead be trusting in that you are probably right.
Happy trading!
Theory: Forex 101
A bear chased two hikers. One hiker, while being chased, stopped to put on running shoes.
As he was changing out of his hiking boots, his companion looked at him in horror and exclaimed, "What in the world are you doing? You'll never outrun the bear if you stop now!"
Calmly, the other hiker said, "I don't have to outrun the bear. I just have to outrun you."
Forex, Foreign Exchange, FX ... whatever name it goes by it can be a daunting thing when you first encounter it. There are so many terms and concepts to understand that without some guidance it can become "all to hard". So in response to the requests I have received, here is a beginners guide to the basic concept of what Forex is.
Currency Pair
A currency pair is a representation of one currency against another. For example one currency pair is the EUR/USD, or the Euro to the US Dollar. If the EUR/USD is listed at 1.2150, you read this as 1 Euro will but 1.2150 US dollars.
Pip
Learn to love this word, because this is what you will be seeking for the rest of your forex career. A pip is the smallest denominator of a particular currency pair, so for the above example, if the EUR/USD moves from 1.2150 to 1.2155 then it has moved up 5 pips.
Leverage
This one I'll leave to robbooker.com:
Leverage is a simple concept. If you have $10,000 to trade with, your forex broker will let you borrow money from him so that you can trade in larger quantities. They will let you borrow as much as 400 times (400:1) what you put up in a trade. Most brokers allow between 50:1 and 100:1 margin. So, if you put up $1,000, and your broker allows 100:1 margin, then you'll be trading $100,000 worth of currency (instead of $1,000).
That's important, because every pip equals a certain dollar amount. When you trade $10,000, each pip movement equals $1. The chart below shows how it goes from there. If you trade 10,000 worth of currency, each movement would be equal to $1. So if you bought at 1.1445 and sold at 1.1545, you would make 100 x $1, or $100. If you trade $100,000, each pip movement would equal $10 and so on.
Going Long and Short
Now there is two different ways you can trade on the forex market, and many beginner traders are surprised to learn that you can actually make just as much money when a currencies price moves down as you can when it moves up. Let's start with the most logical movement, when the price moves up.
Most people are very familiar with the concept of buying something at a low price and selling it when the price increases. So the concept of buying the EUR/USD at 1.2150 and selling it at 1.2160 for a 10 pip gain should seem logical. This process is called going long.
However, you can also do this in reverse! If you think you know that a currencies price is going to go down rather than up, the you can go short. This is just the opposite of the above transaction, selling it first and buying it back later in the hope that the price will go down for you to make a profit.
This can be somewhat strange for those hearing this for the first time, but the concept remains the same either way, that being, that you always want to buy something at a low price, and sell it at a higher price than you bought it at. Which order you do it in doesn't matter, just that for a transaction to complete you must both buy and sell, as long as you sell at a higher price than you buy then you make profit.
Spread
 The difference between the stock markets and the forex market brokers, is that in the forex market, broker commissions are either very low or zero. So how do the make money?, they make it from the "spread" or the difference between the actual price and the offered price through a broker.
To the right here you can see a typical board of currency pairs and their spreads. This one is taken from Marketiva this morning, and you can see for example the difference between the Offer (the price you can place a sell order) and the Bid (the price you can place a buy order) is 3 pips (the spread).
What does this mean to you though?, well, let's look at the board, if you bought the EUR/USD at 1.2158 as it is offered under the Offer column, and immediately sold it again before the price moved, you would only get 1.2155 as is shown in the Bid column. So the net result is -3 pips, or a loss to you, and a profit to the broker. Remember to always take the spread into account when placing a trade, setting targets and stop losses.
Stop Losses and Profit Targets
This is something I will go into much more in upcoming articles, but it is something that I view as vital for all beginners to understand. When placing a trade, the price has the potential to do three things, move up, move down or move sideways. If you are long in a trade and need the price to go up, what happens if you pop into the kitchen for a cup of tea and when you are gone the price drops dramatically? Remember, on a full forex account, each pip can equal $10, so any movement in the opposite direction can of course lose you money. A stop loss is your protection against big losses.
Placing a stop loss is like doing up the zipper of your pants ... you don't have to do it, but it is damn embarrasing when you get caught out!
The same applies for the other way around, if the price moves in your favour while you are away, before dropping again, if you are not there to close the trade at a profit, you may have missed your opportunity. A profit target is a place to take your profits.
When you place a trade you can set a price where, if it moves to that price, the trade will automatically be closed for you. Setting this price in the opposite direction of what you want the price movement to be is a "stop loss", or a level where your trade is "stopped" to minimise your losses. Now you may think "well how bad can it be" ... have a look at the below 15M chart from yesterdays GBP/USD.
 Look at the two highlighter areas, if you had place a long trade (i.e. you think the price is going to continue up) as the price started to move upwards after the first initial drop (the first highlighted area), thinking "well that is the end of that move", then walked away without a stop loss, you would have been in some real mess 3 hours later when the price dropped again another 154 pips, or, on full account $1540!!
The Bears and the Bulls
You will constantly see the term "Bears" and "Bulls" in forex books and chat rooms. So why are we talking about animals when we are supposed to be trading? These are terms that describe the general mood of the market. A "bear" market, is when the general mood of the market is down, i.e. when there are more sellers than buyers in the marketplace. A "bull market" is the opposite, when there are more buyers than sellers and the general mood of the market is up.
Forex and any other marketplace, is just a struggle between the bulls and the bears, it if you can identify who is gaining the upper hand, then you can identify the direction of the price. Easier said than done of course.
Well that about covers the basics, there are so many more areas to cover of course but I hope it helps those starting out in this exciting marketplace. If I have missed something you wanted to read about please leave a comment below and I will be sure to add it to the article if I can.
Best of luck to you all!
Theory: Fibonacci
Hey all,
First of all, very sorry about the lack of updates the last couple of days, but would you believe TODAY is the due date of baby Akuma, but of course, I would not be writing this if it was on it's way ;). My trading activity has been very low lately, but Ill be sure to post at least the results soon, but instead, I thought I would put together a new theory article for you all, this time about Fibonacci.
Fibonacci was named after a mathemetician and trained accountant by the name of Leonardo Pisano in the 1100's (ah yes I remember them well ... those were the days). He came up with, amongst other things, a series of numbers that is now referred to as the Fibonacci sequence, where each number is the sum of the two numbers preceding it. Here is the beginning of it, and of course it goes on to infinity:
1, 1 (1+0), 2 (1+1), 3 (2+1), 5 (3+2), 8 (5+3) etc.
Pretty simple huh! ... this guy is famous cause of that simplicity though, which gives us all hope ;). Anyhow from these numbers a whole bunch of ratios can be taken from them, now I'm not going to pretend to understand them, but the main ratios, that are reproduced through the world, in nature, buildings, cells, ice cream ... ok not ice cream ... are:
0.236, 0.50, 0.382, 0.618 ...
There are many more, but these are the main ones to concern us beginner traders, and here is why. Quite often in the liquid markets of Forex, prices respect these levels when they move, meaning, just like Pivot Lines, prices will quite often pause, and more often reverse at these levels. Most charting packages have the ability to add Fibonacci lines to your charts, for example in Metatrader 4 all you do is; if the price was moving down, drag a line from the recent peak, to the most recent bottom and the lines are added for you. Unfortunately Marketiva does not offer them as yet, however here is a chart with them drawn:
 The blue dotted lines are the fibonacci lines that correspond to the ratio's I was talking about. You can see in the move up, that the 38.2 fibonacci line formed the point for the price to reverse its retracement and continue with the trend (support). Of course, any of these lines could have been the points of reversal, but a reversal at the 38.2 line is a good sign that the trend will continue as the retracement was shallow.
The other line that I find most commonly hit is the 61.8 line as shown here:
Be a little more wary when such a deep retracement occurs, as it is less likely (although not in the above case) that the previous support will be broken again.
So what do you do with this knowledge? Can you trade with fibonacci alone? In my opinion, no as you don't know which line will be the turning point without the aid of other indicators or reading the price action, but they can be an excellent addition to your trading system to confirm other signals. For example if you have a signal from another indicator telling you a reversal is about to happen, and price is hovering at a fibonacci line, this might give you added confidence to place the trade.
Happy trading!
 The blue dotted lines are the fibonacci lines that correspond to the ratio's I was talking about. You can see in the move up, that the 38.2 fibonacci line formed the point for the price to reverse its retracement and continue with the trend (support). Of course, any of these lines could have been the points of reversal, but a reversal at the 38.2 line is a good sign that the trend will continue as the retracement was shallow.
The other line that I find most commonly hit is the 61.8 line as shown here:

Be a little more wary when such a deep retracement occurs, as it is less likely (although not in the above case) that the previous support will be broken again.
So what do you do with this knowledge? Can you trade with fibonacci alone? In my opinion, no as you don't know which line will be the turning point without the aid of other indicators or reading the price action, but they can be an excellent addition to your trading system to confirm other signals. For example if you have a signal from another indicator telling you a reversal is about to happen, and price is hovering at a fibonacci line, this might give you added confidence to place the trade.
Happy trading!
Theory: Divergence
If you have been around Forex chat rooms or forums for any amount of time, one term you would have heard of many times is Divergence. While by no means a fool proof indication, it is a nice thing to store in the back of your already full brain to help you in confirming suspected trend changes.
Above is a snap shot of the hourly chart of AUD/USD in the week just gone (click on it to see it larger). Divergence is essentially when an indicator is trending in the opposite direction to the price. You can see in the above chart, a trend line clearly shows the price at this time is making a series of lower highs and lower lows, so it is in a clear downtrend.
Below that is an indicator called the Stochastics, with settings of 15, 5, 5. Here you can see that as the price is making lower lows, the indicator is making HIGHER lows, so the price is downtrending, the stochastic indicator is in an uptrend, this is Divergence.
When you see this occur, look out for a sign of a reversal of the current price trend, in this case, it happened when the price broke the trend line as indicated by the orange area. I don't trade this method currently of course, but it something good to know, and something to look out for if you are trying to figure out if the trend will continue.
Best of luck, hope it helps.
Theory: Compounding
 Good afternoon all and I hope you are having a great weekend!
It has been a while since posting my last theory article, so let's get back on the bandwagon and talk about the trading and compounding. I think it is most traders dream to be able to escape the rat race, tell your boss where to go (that's if you don't like him/her of course) and let you trading skills lead you on the road to riches. I'm also sure a lot of you would have heard the saying "it takes money to make money" (if I hear it one more time .. arrgg), which to me is kind of deflating, why can't someone with very little money make money? Well pleasingly, for all of you that aren't driving a BMW and spending their weekend on their private yaughts, compounding is most likely a big part of your solution, so let's look at why.
The easiest and most used analogy when describing compounding is the good old snowball, which to me, living in "the sunburnt country", is somewhat foreigh so i'll have to draw on the imagination for this one. In trading, compounding is when you add your previous earnings onto your existing account size and adjust your trade size accordingly. Umm ok let me try to explain.
Let's look at the two trading scenarios, let's say you have opened a mini account with $1000US, this traditionally would let you trade "mini lots" or lots of 10,000 in size, where each pip would equal $1 US approximately (depending on the pair). If you make five "mini lot" trades on the GBP/USD, with each trade earning you 50 pips, you would have your original $1000 plus 5x$50 ... so $1,250 all up (as well as bragging rights for your 5 straight winners of course). This is just like someone packing a tiny snowball, rolling it down the hill five times, and each time you dusting of any excess snow that acumulated from the previous roll before rolling it again. (can you tell i'm struggling with the whole snow thing). Now let's look at the same trades but include compounding in the scenario. Remember compounding is adding the previous winnings to the account and adjusting your lot size according to some rule. So , from the previous example, after trade 1, our account has gone from $1000 to $1050 (50 pips at $1 each pip). A gain of $50 on a $1000 is a return of 5% of your account, so one compounding strategy would be to increase your lot size by the same amount. Now we are trading lot sizes of 10500 (500 is 5% of 10000), so each pip now equals $1.05. This means trade 2, which returns 50 pips now earns you $52.5 instead of $50, moving your account to $1102.50 instead of $1100. In snowball terms, it is like taking that small snowball rolling it down the hill five times, but each time leaving the excess, and just rolling it right back up there to acumulate even more. (gee im glad that snow thing is over with).
... compounding really is a great tool for all those that can't subscribe to "it takes money to make money" ...
Now what we really want to know, what does it mean to the road to riches? Well if you can make let's say a 50% annual return on your account (certainly acheivable), this time in around 17-18 years you will be a millionaire, sipping a cocktail on a beach somewhere in the bahamas (unless you live there, in which case that would kind of be pointless ... anyway). If you can make a 100% annual return then somewhere around 10 years you would make your first million, not bad from $1000US. The beauty of us as traders is we are not restricted to compounding annually, monthly or even weekly as in a traditional savings account or managed investment portfolio, we can actually compound daily, or even trade by trade.
Compounding really is a great tool for all those that can't subscribe to "takes money to make money", and an even better weapon for those that can.
Happy trading!
Theory: Candlesticks
Hi all, today I'll have a quick chat on the theory of Japanese Candlesticks. In case you did not realise, there are three main ways to view a trading chart, you can view it as a line chart, a bar chart, or a candlestick chart. Below are what each of these look like:
Candlestick's were first introduced in the 1600's, strangely enough to analyze the price of rice contracts. There is no special calculation, they are simply an alternative way of representing current prices. Below is the basic rundown of what a single candlestick looks like, and how it is interpreted. This is a candlestick you would see most often in a downtrend, with the black body being a sign that the closing price finished lower than the opening price.
Here you can see labelled the opening, closing, high and low of the particular period that this candle is representing, which could be 5 minutes, 1 hour or 1 day depending on what chart you are looking at.
Some charts have candles that represent this scenario coloured in red, either way, the main thing is to remember that usually this type of candle will usually be filled.
So that is what a "down" candle looks like, a candle representing the opposite scenario, i.e. when the closing price finishes above the opening price usually is white, or uncoloured and looks like below: You can see that the main difference between this candle and the above candle is that the closing price is above the opening price, indicating that during this period, the price went up during this period.
Some charting packages will show this candle as a green candle, some as white, or some with no colour at all, just an outline. If you set the colour scheme yourself, just recognise that you need to make this candle different to the above candle so you can distinguish the difference.
Now if I was to run through every type of candle that existed in the theory of candlestick charts, I would more than likely get cramp and brain freeze, and not finish this article. So instead, I will run through some basic deduction you can take from interpreting a few different types of candles. Have a look at this candle (called an inverse hammer), you can see the main difference between this candle and the basic candle I showed you above is the lack of a thin line below body (the thicker white area) of the candle. So what does this mean? The thin lines are refered to as "wicks" or "shadows", and represent when prices move up or down, but are then dragged back.
How to read this candle? Well here the price closed well above it's opening price, there was a push for higher prices as represented by the upper wick, which was pulled back slightly. Depending on the market, you may read this as a sign that price will continue with the upward push, as the price didn't retract too far, and there was no real push for lower prices. Ok here is another (called a hammer), the inverse of the previous candle, here you can see the closing price was lower than the opening price, hence the black body of the candle. It has a medium length wick also, which again is a sign that there was a move to push the prices lower. You make this candle to be a sign of strength in a down move, or a sign of a reversal, or pause in an uptrend.
To me the wicks are just as important as the bodies of candles, and should be taken into as much consideration as the colour and length of the body. Now there are a bucket load of different candle types as I mention earlier, but to give you an idea, here are a few that I find to be the most telling when reading candlestick charts. This candle is referred to as a "doji", and you can see has very little, or in this case no body to it. This candle is a sign of indicision in the market, as the wicks above and below the non existant body reflect that there was a push up, and a push down, resulting in a stalemate with the opening price and the closing price being the same in the end.
This candle, a hammer, is a strong sign if seen at the bottom of a downtrend, when you suspect that a currency may be oversold. Here you can see a very long bottom wick in comparison to it's body, and tells the story that prices made a strong move down, but was dragged back above it's opening price, hence the white body. A candle with such a long wick as this, is usually a good sign that the momentum of a downward move is stalling or reversing. Here you can see a variation on the inverse hammer candle I showed you previously, with the main difference being that this one having a much longer upper wick, and the closing price finished below the opening price. This candle can quite often be a sign of a change in momentum, as the strong push to higher prices, as shown by the long upper wick, was pulled back so far that the prices closed lower, a sign that future pushes to higher prices may be rejected. This candle is especially valid in an uptrend where you may suspect that a currency is overbought.
There are so many more, and I haven't even touched on combining these candles into different formations. I have however, provided a link to an e-book on this subject that covers all the basics in a text book fashion that can be a good reference for you all.
Please do not take this candles as given, like any other indicator, they are just guides that can help you, but it is always safe to look for confirmation either in the next candle or with other indicators. Oh and one last tip, never trade on an incomplete candle, always wait for that period to end before assuming the candle is a certain type. Quite often the biggest moves are at the end of the period you are looking at, and what you thought was one type of candle become something completely different in the matter of seconds.
Best of luck with them, I personally feel candles tell you much more than a line graph ever could, and while bar charts can tell you the same information, I find candlesticks much easier, and more importantly, much faster to read. Please leave a comment if there is something vital I have missed.
Happy trading!
Theory: Chart Correlation
Hi all,
I thought I would mention a very simple concept that I know a lot of traders know of, but there may be some who don't. The concept is of chart correlation, i.e. when one pair goes up, another pair goes down.
This concept is especially true for all the majors and there is a very simple reason why. All the majors have one thing in common, the USD, in general it is the USD that drives the pairs up and down, there are of course the odd exception with region specific data releases etc, but as a whole it is the USD that drives things. So if the USD gets stronger, then more than likely the USD/JPY will rise, while the EUR/USD will fall. Don't believe me? Let's look at some charts I have prepared earlier ;), I have overlayed and coloured them to make them easier to compare:
EUR/USD 1H over the USD/CHF 1H
You can see they are practically mirror images of each other. Now how about two pairs with USD as their base currency, lets look at the EUR/USD again but against the GBP/USD:
EUR/USD 1H over the GBP/USD 1H
You can see they play follow the leader for most of the time. You can see then that most of the time, it would be contradictory to have a swing trade short on the EUR/USD and a short on the USD/CHF at the same time, one is doomed for failure. You can compare all the majors and the action is essentially the same, here is the EUR/USD over the USD/JPY:
EUR/USD 1H over the USD/JPY 1H
I think I have made my point. There is however the odd exception, although not amongst the majors, currently that "black sheep" is the USD/CAD. You would expect, with the USD as it's base also it should follow the pattern of the USD/JPY and the USD/CHF, but, as it is a commodity and energy reliant pair, and considering the current energy crisis the world is under, the USD/CAD currently is leading it's own life. Here is the EUR/USD over the USD/CAD to show you what I mean:
EUR/USD over the USD/CAD
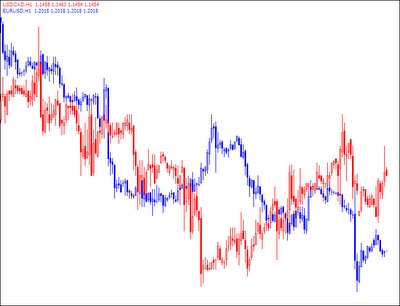
You can see, apart from the new year action that for quite some time the USD/CAD bucked the trend, and moved in the same direction as the EUR/USD as demand for oil prices rose, gold hit new 5 year highs and the canadian economy was going great guns. If you have a charting package that let's you overlay charts, then it is well worth doing every now and then to see how pairs are moving compared to others, it just may stop you trading against yourself.
Happy trading!
Happy trading!
Theory: ADX
Hi all! Well I have mentioned previously that the only indicator I consistently keep on my charts is an indicator called the ADX, or Average Directional Index (why do they always like using "X" for index .. shouldn't it be "I" ... anyway). I use it primarily to keep me in trades that are moving strongly, and to give me hints on how strong a move actually is.
So, considering I talk about it so often I thought it best to give a general rundown on what the indicator can be used for and how you might be able to use it in your trading system.
The ADX was developed by J. Welles Wilder, yep the same guy who developed the Parabolic and RSI indicators, clever chap that Wilder. Interestingly, Wilder considered the ADX to be his best achievement in terms of indicators, and considering the widespread use of RSI and Parabolics, makes you wonder why more aren't using the ADX (although I am sure plenty are, I have after all only surveyed my next door neighbour and my dog).
First of all let's have a look at what it looks like: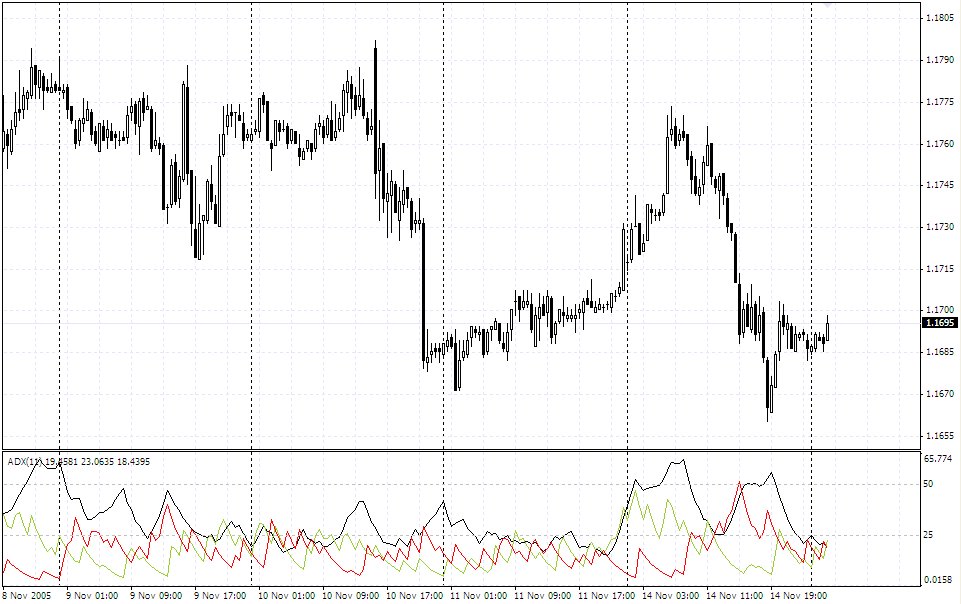 At first it looks all a little like last night's spaghetti, but really it is quite simple. There are three lines, a trend following line, a positive directional line (+DI) and a negative directional line (-DI). In laymans terms, the black line tracks trends, the red line is a signal line to go short, and the green line a signal line to go long.
First the theoretical way to use it. When the red (-DI) line crosses above the green (+DI) line, it is a signal to go short, and vise versa, green above red is a signal to go long (yep just like Moving Average crossovers). Like all indicators though, there is always lag, and as such I pay little attention to these lines and prefer to get my direction signals of the price action itself. The black line though is something different, it is a line that indicates if a trend is in place. If it rises from below 20 (I use 25) to above 20, it is a sign that a trend is developing and to stick with the trade. While the black line rises, I will always stay with a trade unless there is some news announcement coming up that I am worried about. Once the black line ticks down from above 25, it is a signal for you to assess your position as the run may have come to an end for now.
While such a simple technique (I am all about simplicity), you will be surprised how well it will keep you in those strong moves. So that is it, pretty easy huh ... any questions, just throw me an email or comment here.
Best of luck with it.
Happy trading!
Subscribe to:
Posts (Atom)