Hi all! Well I have mentioned previously that the only indicator I consistently keep on my charts is an indicator called the ADX, or Average Directional Index (why do they always like using "X" for index .. shouldn't it be "I" ... anyway). I use it primarily to keep me in trades that are moving strongly, and to give me hints on how strong a move actually is.
So, considering I talk about it so often I thought it best to give a general rundown on what the indicator can be used for and how you might be able to use it in your trading system.
The ADX was developed by J. Welles Wilder, yep the same guy who developed the Parabolic and RSI indicators, clever chap that Wilder. Interestingly, Wilder considered the ADX to be his best achievement in terms of indicators, and considering the widespread use of RSI and Parabolics, makes you wonder why more aren't using the ADX (although I am sure plenty are, I have after all only surveyed my next door neighbour and my dog).
First of all let's have a look at what it looks like: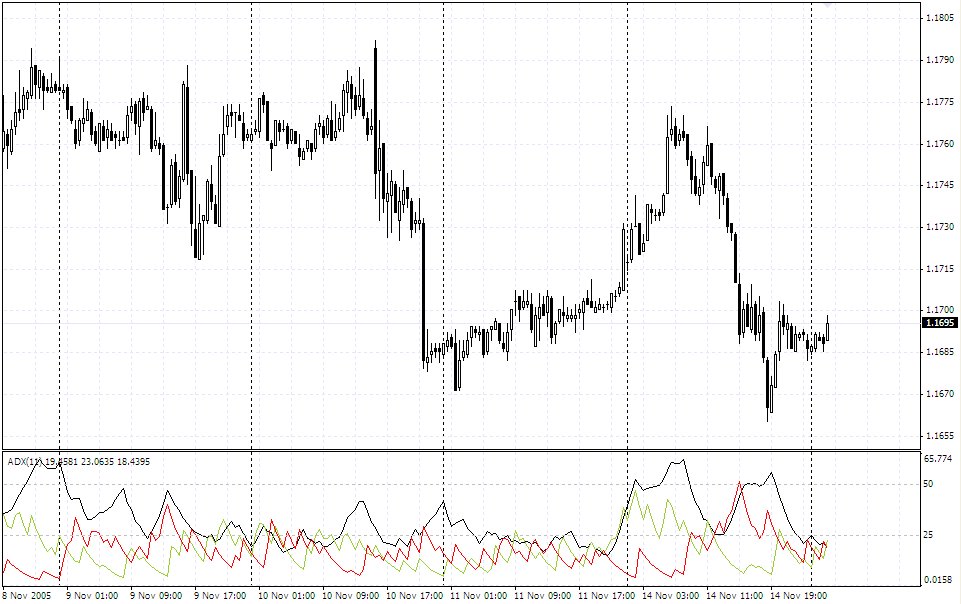 At first it looks all a little like last night's spaghetti, but really it is quite simple. There are three lines, a trend following line, a positive directional line (+DI) and a negative directional line (-DI). In laymans terms, the black line tracks trends, the red line is a signal line to go short, and the green line a signal line to go long.
First the theoretical way to use it. When the red (-DI) line crosses above the green (+DI) line, it is a signal to go short, and vise versa, green above red is a signal to go long (yep just like Moving Average crossovers). Like all indicators though, there is always lag, and as such I pay little attention to these lines and prefer to get my direction signals of the price action itself. The black line though is something different, it is a line that indicates if a trend is in place. If it rises from below 20 (I use 25) to above 20, it is a sign that a trend is developing and to stick with the trade. While the black line rises, I will always stay with a trade unless there is some news announcement coming up that I am worried about. Once the black line ticks down from above 25, it is a signal for you to assess your position as the run may have come to an end for now.
While such a simple technique (I am all about simplicity), you will be surprised how well it will keep you in those strong moves. So that is it, pretty easy huh ... any questions, just throw me an email or comment here.
Best of luck with it.
Happy trading!
Wednesday, 23 July 2008
Theory: ADX
Labels: Theory: ADX